Building a Raspberry Pi Pico W & LM35 Web Server

Introduction
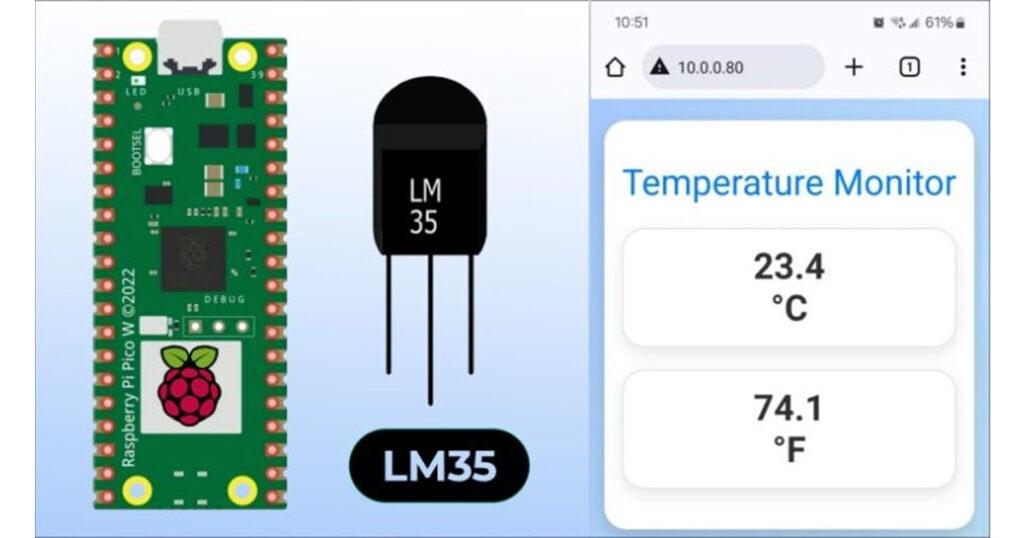
In this project, we’ll use MicroPython on the Raspberry Pi Pico W to read the temperature data from the LM35 sensor and serve it on a web page through the Pico W’s built-in Wi-Fi. This will enable easy and efficient temperature monitoring. Moving away from traditional methods such as utilizing an Raspberry Pi Pico & LM35 for Terminal display, we’ll use the Raspberry Pi Pico W’s ability to host a web server.
The web server will display the temperature readings on a webpage, accessible through any standard web browser. This technique modernizes the method of displaying temperature readings and facilitates remote monitoring of temperature over a local network.
The LM35 Temperature Sensor is an analog device, with its output directly proportional to the Centigrade temperature. It provides a temperature measurement range from -55°C to +150°C with an accuracy of +/- 0.75°C. This broad measurement range and notable accuracy make the LM35 a versatile choice for diverse temperature sensing applications.
LM35 Temperature Sensor

The LM35 series are precise temperature sensors with an output voltage linear to the Centigrade temperature, eliminating the need to subtract a constant voltage for Centigrade scaling unlike Kelvin-calibrated sensors. It achieves typical accuracies of ±0.25°C at room temperature and ±0.75°C across a -55°C to 150°C range without external calibration.
Its cost-effectiveness is ensured by wafer-level trimming and calibration. The LM35’s low-output impedance, linear output, and inherent calibration facilitate easy interfacing with circuitry. It operates on single or dual power supplies, drawing only 60 µA, which minimizes self-heating to under 0.1°C in still air.
Features
- Calibrated directly in Degree Celsius (Centigrade)
- Linear at 10.0 mV/°C scale factor
- 0.5°C accuracy guarantee-able (at a25°C)
- Rated for full -55°C to a 150°C range.s
- Suitable for remote applications
- Low cost due to wafer-level trimming
- Operates from 4 to 30 volts
- Less than 60 mA current drain
- Low self-heating, 0.08°C instill an air
- Non-linearity only 0.25°C typical
- Low impedance output, 0.1Ωfor 1 mA load
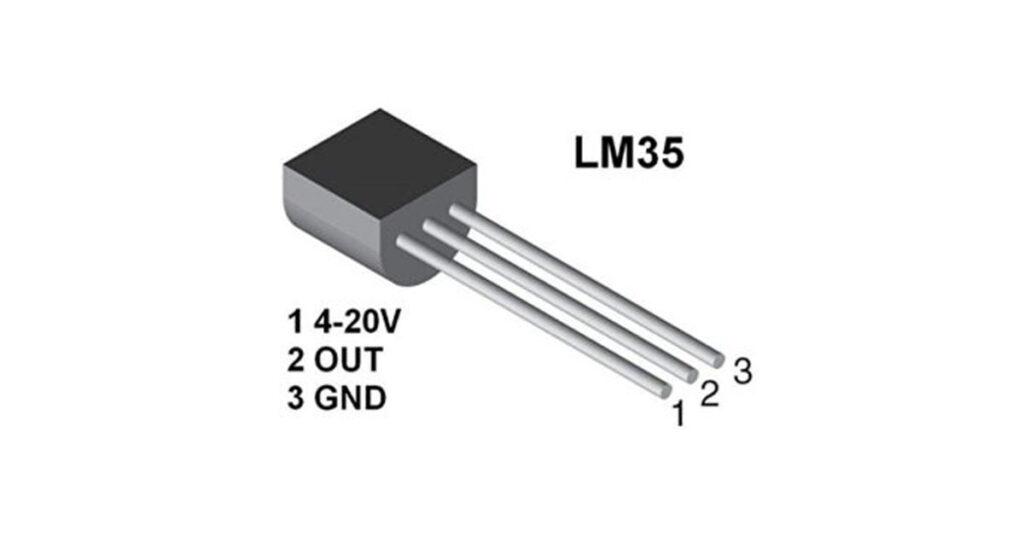
Connecting LM35 Temperature Sensor with Raspberry Pi Pico W
Let’s connect the LM35 Temperature Sensor with the Raspberry Pi Pico W Board. The process for connecting the sensor is very simple.
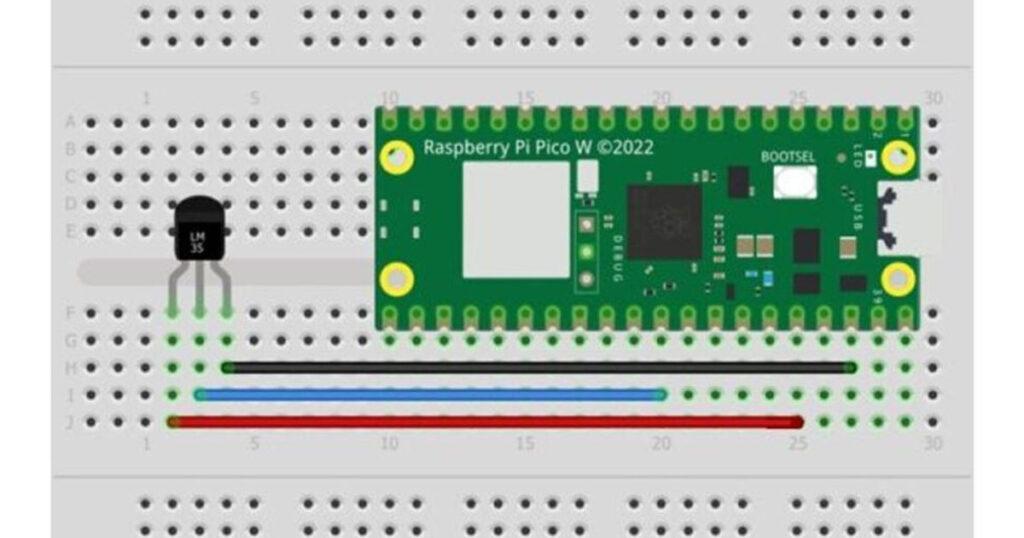
- Connect the VCC of the LM35 to the 3.3V (Vin) on the Pico W.
- Connect the GND of the LM35 to a GND pin on the Pico W.
- Finally, connect the Vout (output) of the LM35 to a GP26 on the Pico W

For making the connections, a breadboard & jumper wires can be used.
Building a Raspberry Pi Pico W & LM35 Web Server
Lets write a MicroPython Code to build a Raspberry Pi Pico W & LM35 based Web Server, where we can display the temperature reading dynamically without refreshing the webpage.
The following two code sets up a Raspberry Pi Pico W as a web server to display temperature readings from an LM35 temperature sensor. It first establishes a Wi-Fi connection using predefined SSID and password, then listens for incoming HTTP requests on port 80. Upon receiving a request, it checks if the request is to read the temperature; if so, it computes the temperature in Celsius and Fahrenheit using the sensor’s reading, and responds with these values in JSON format.
The web server displays temperature readings in Celsius and Fahrenheit, which are dynamically updated through JavaScript fetching data from the server.
main.py
Copy the following code and paste it on the editor window of Thonny IDE. Save it to the Raspberry Pi Pico W board with the name main.py
ssid = '*********'
password = '*********'
Change the WiFi SSID & Password from the above lines.
Here is the full code for the project.
import network
import socket
import machine
import utime
from html import html_page  # Import the HTML content from html.py

# Initialize ADC for LM35 temperature sensor
# Note: Adjust the ADC pin according to your setup
LM35 = machine.ADC(26)
Cal_Offset = -1650  # Calibration offset

# Function to compute temperature from LM35 sensor readings
def compute_temp(avg_a):
    lm35_a = avg_a + Cal_Offset
    lm35_v = lm35_a * .00005  # Convert ADC value to voltage
    temp_c = round((lm35_v * 100), 1)  # Convert voltage to Celsius
    temp_f = round((temp_c * 1.8 + 32), 1)  # Convert Celsius to Fahrenheit
    return temp_c, temp_f

# Connect to Wi-Fi
ssid = 'Kaushar'
password = 'Z@kiza1nyfc'
wlan = network.WLAN(network.STA_IF)
wlan.active(True)
wlan.connect(ssid, password)

# Wait for connection
while not wlan.isconnected():
    utime.sleep(1)

print('Connected to Wi-Fi')
ip_address = wlan.ifconfig()[0]  # Get the IP address
print('IP Address:', ip_address)

# Create a socket to listen on port 80
s = socket.socket(socket.AF_INET, socket.SOCK_STREAM)
s.bind(('', 80))
s.listen(5)

print('Listening on port 80...')

# Main loop
while True:
    conn, addr = s.accept()
    print('Got a connection from %s' % str(addr))
    request = conn.recv(1024)
    request_str = str(request)
    print('Content = %s' % request_str)

    # Check if the request is for reading the temperature
    if 'readTemp' in request_str:
        temp_c, temp_f = compute_temp(LM35.read_u16())  # Get temperature readings
        response = '{{"celsius": "{}", "fahrenheit": "{}"}}'.format(temp_c, temp_f)
        conn.send('HTTP/1.1 200 OK\n')
        conn.send('Content-Type: application/json\n')
        conn.send('Connection: close\n\n')
        conn.sendall(response)
    else:
        # Serve the HTML page for any other request
        conn.send('HTTP/1.1 200 OK\n')
        conn.send('Content-Type: text/html\n')
        conn.send('Connection: close\n\n')
        conn.sendall(html_page)

    conn.close()
html.py
Copy the following code and paste it to the editor window of Thonny IDE. Save it to the Raspberry Pi Pico W board with the name html.py.
# html.py
html_page = """<!DOCTYPE html>
<html lang="en">
<head>
<meta charset="UTF-8">
<meta name="viewport" content="width=device-width, initial-scale=1.0">
<title>Temperature Monitor</title>
<link href="https://fonts.googleapis.com/css2?family=Roboto:wght@100;400;700&display=swap" rel="stylesheet">
<style>
body {
margin: 0;
padding: 20px;
font-family: 'Roboto', sans-serif;
background-color: #f0f0f0;
color: #333;
display: flex;
justify-content: center;
align-items: center;
height: 90vh;
background-image: linear-gradient(120deg, #a1c4fd 0%, #c2e9fb 100%);
}
.container {
text-align: center;
padding: 2em;
background: white;
border-radius: 20px;
box-shadow: 0 10px 25px rgba(0,0,0,0.2);
max-width: 400px;
transition: transform 0.5s ease;
}
h1 {
color: #017bff;
font-weight: 400;
}
.temperature {
margin: 20px 0;
padding: 15px 0;
background: rgba(255, 255, 255, 0.9);
border: 1px solid #ddd;
border-radius: 20px;
box-shadow: 0 5px 15px rgba(0,0,0,0.1);
transition: all 0.5s ease;
}
.temperature:hover {
background: #017bff;
color: #fff;
cursor: pointer;
}
.temperature span {
display: block;
font-size: 2.5em;
font-weight: 700;
}
.degree-symbol {
font-size: 0.5em;
vertical-align: super;
}
@keyframes fadeIn {
from { opacity: 0; transform: scale(0.95); }
to { opacity: 1; transform: scale(1); }
}
@media (max-width: 600px) {
.container {
padding: 1em;
}
.temperature span {
font-size: 2em;
}
}
</style>
</head>
<body>
<div class="container" style="animation: fadeIn 1s ease-out;">
<h1>Temperature Monitor</h1>
<div class="temperature" onclick="fetchTemperature()">
<span id="TempValueCelsius">--</span>
<span class="degree-symbol">°C</span>
</div>
<div class="temperature" onclick="fetchTemperature()">
<span id="TempValueFahrenheit">--</span>
<span class="degree-symbol">°F</span>
</div>
</div>
<script>
function fetchTemperature() {
var xhttp = new XMLHttpRequest();
xhttp.onreadystatechange = function() {
if (this.readyState == 4 && this.status == 200) {
var data = JSON.parse(this.responseText);
document.getElementById("TempValueCelsius").innerHTML = data.celsius;
document.getElementById("TempValueFahrenheit").innerHTML = data.fahrenheit;
animateTemperature();
}
};
xhttp.open("GET", "readTemp", true);
xhttp.send();
}
function animateTemperature() {
var temps = document.querySelectorAll('.temperature');
temps.forEach(function(temp) {
temp.style.transform = 'scale(1.05)';
setTimeout(function() {
temp.style.transform = 'scale(1)';
}, 500);
});
}
// Initial fetch
fetchTemperature();
// Set interval to fetch temperature every 5 seconds
setInterval(fetchTemperature, 2000);
</script>
</body>
</html>
"""Checking the Temperature Readings on Webpage
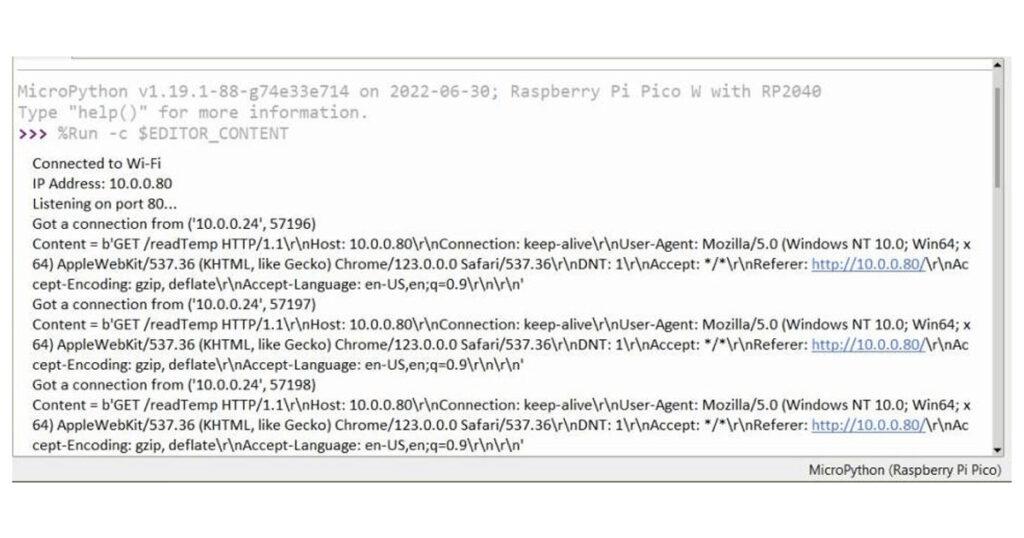
To begin with reading the temperature, run the main.py code on your Raspberry Pi Pico W. The Terminal window will display the IP Address of the Raspberry Pi Pico W.
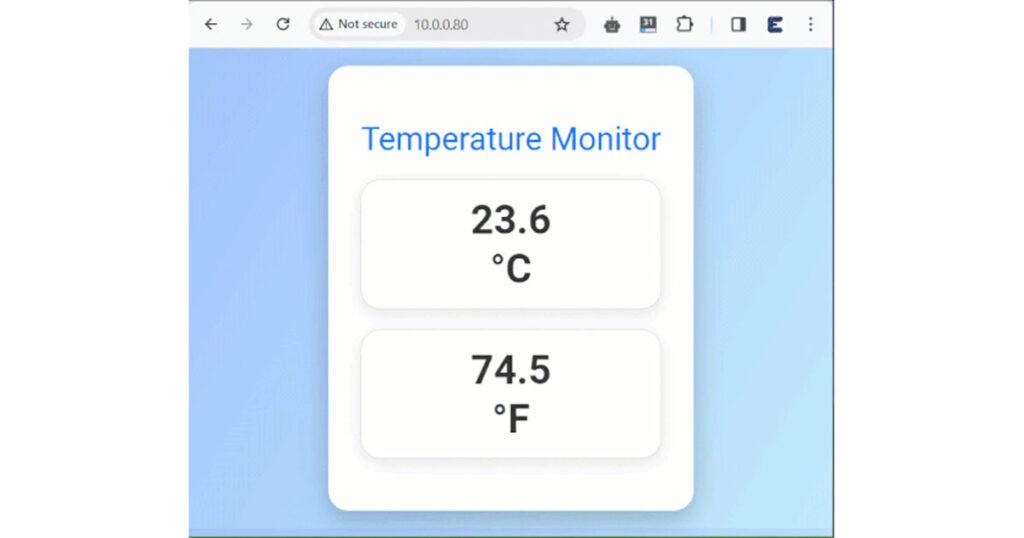
Open a web browser and enter this IP address to access the webpage, where you will see the live temperature readings update automatically.
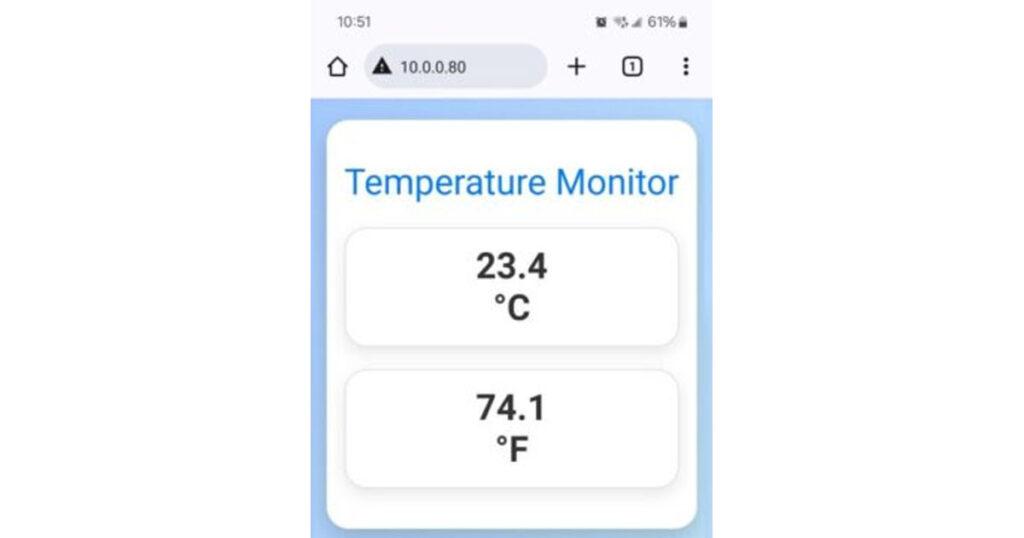
The webpage will show real-time temperature data in both Celsius and Fahrenheit, dynamically updated at intervals set by the JavaScript in the HTML code.
Ensure your computer or smartphone is connected to the same local network as the Raspberry Pi Pico W for accessibility. If you encounter any issues, check the Raspberry Pi Pico W’s Wi-Fi connection and ensure the server is running without errors.